Example Datasheets, Ethograms and Guidance
Focal and Scan Templates
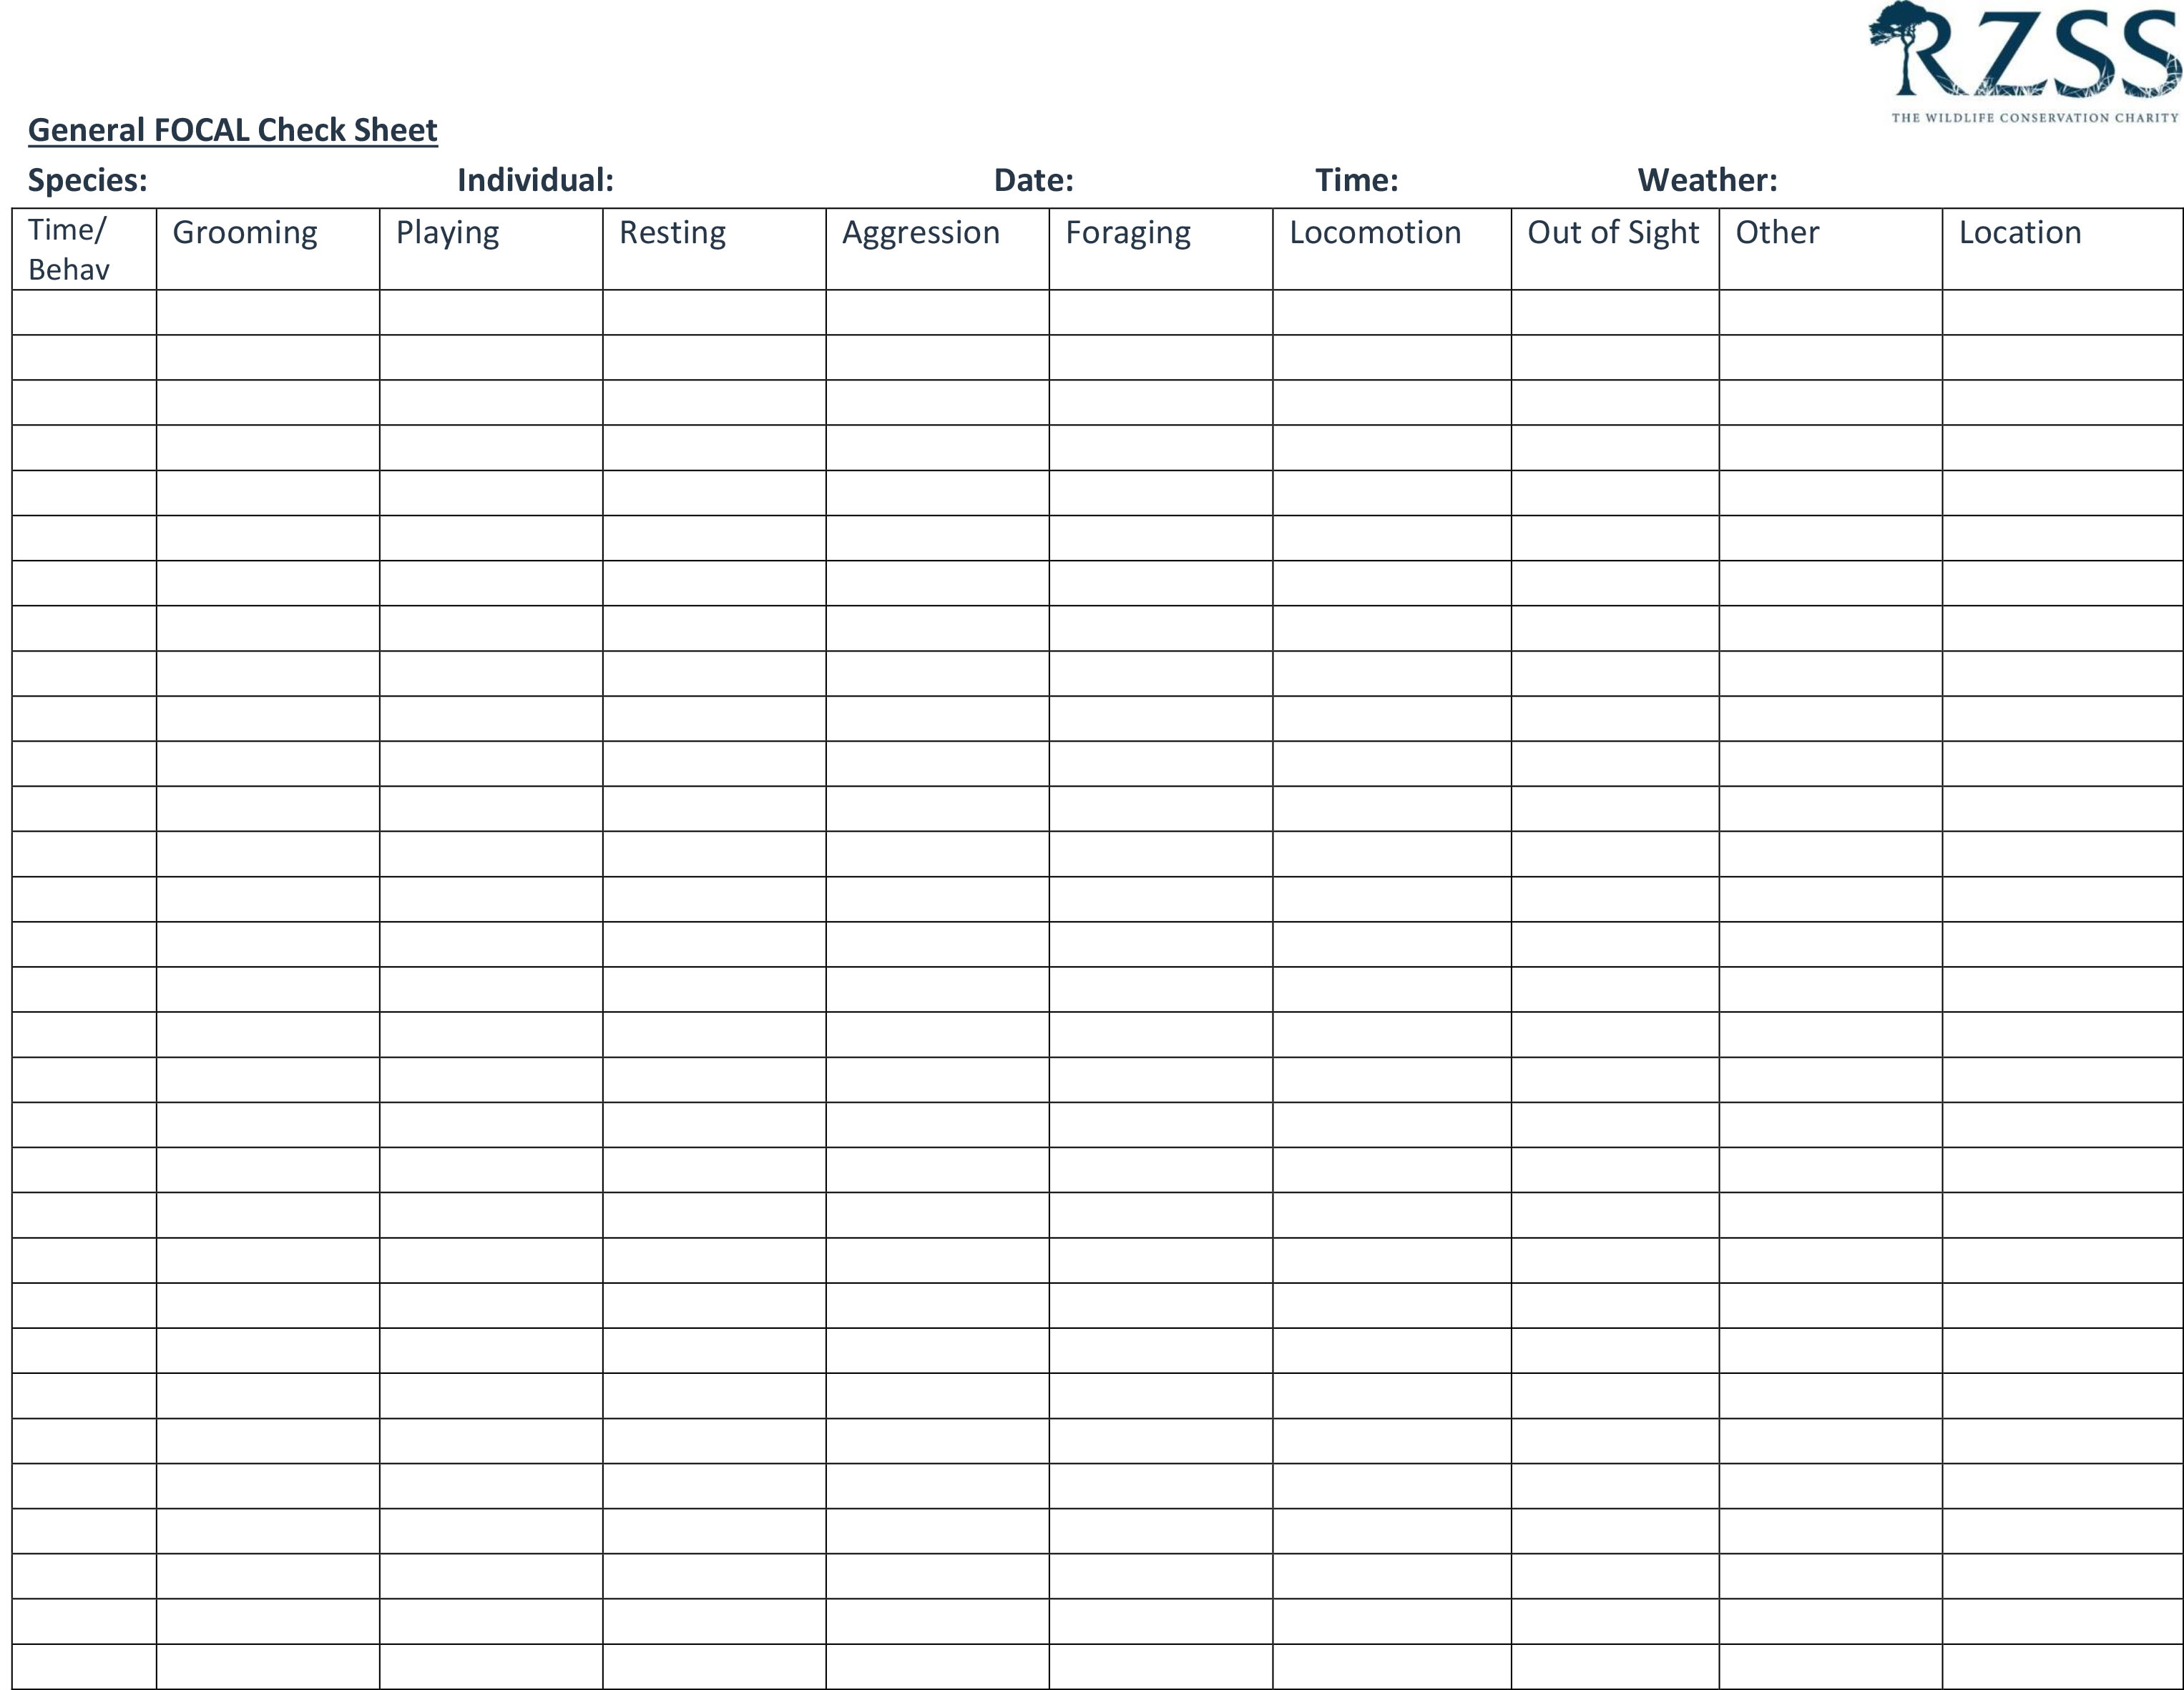
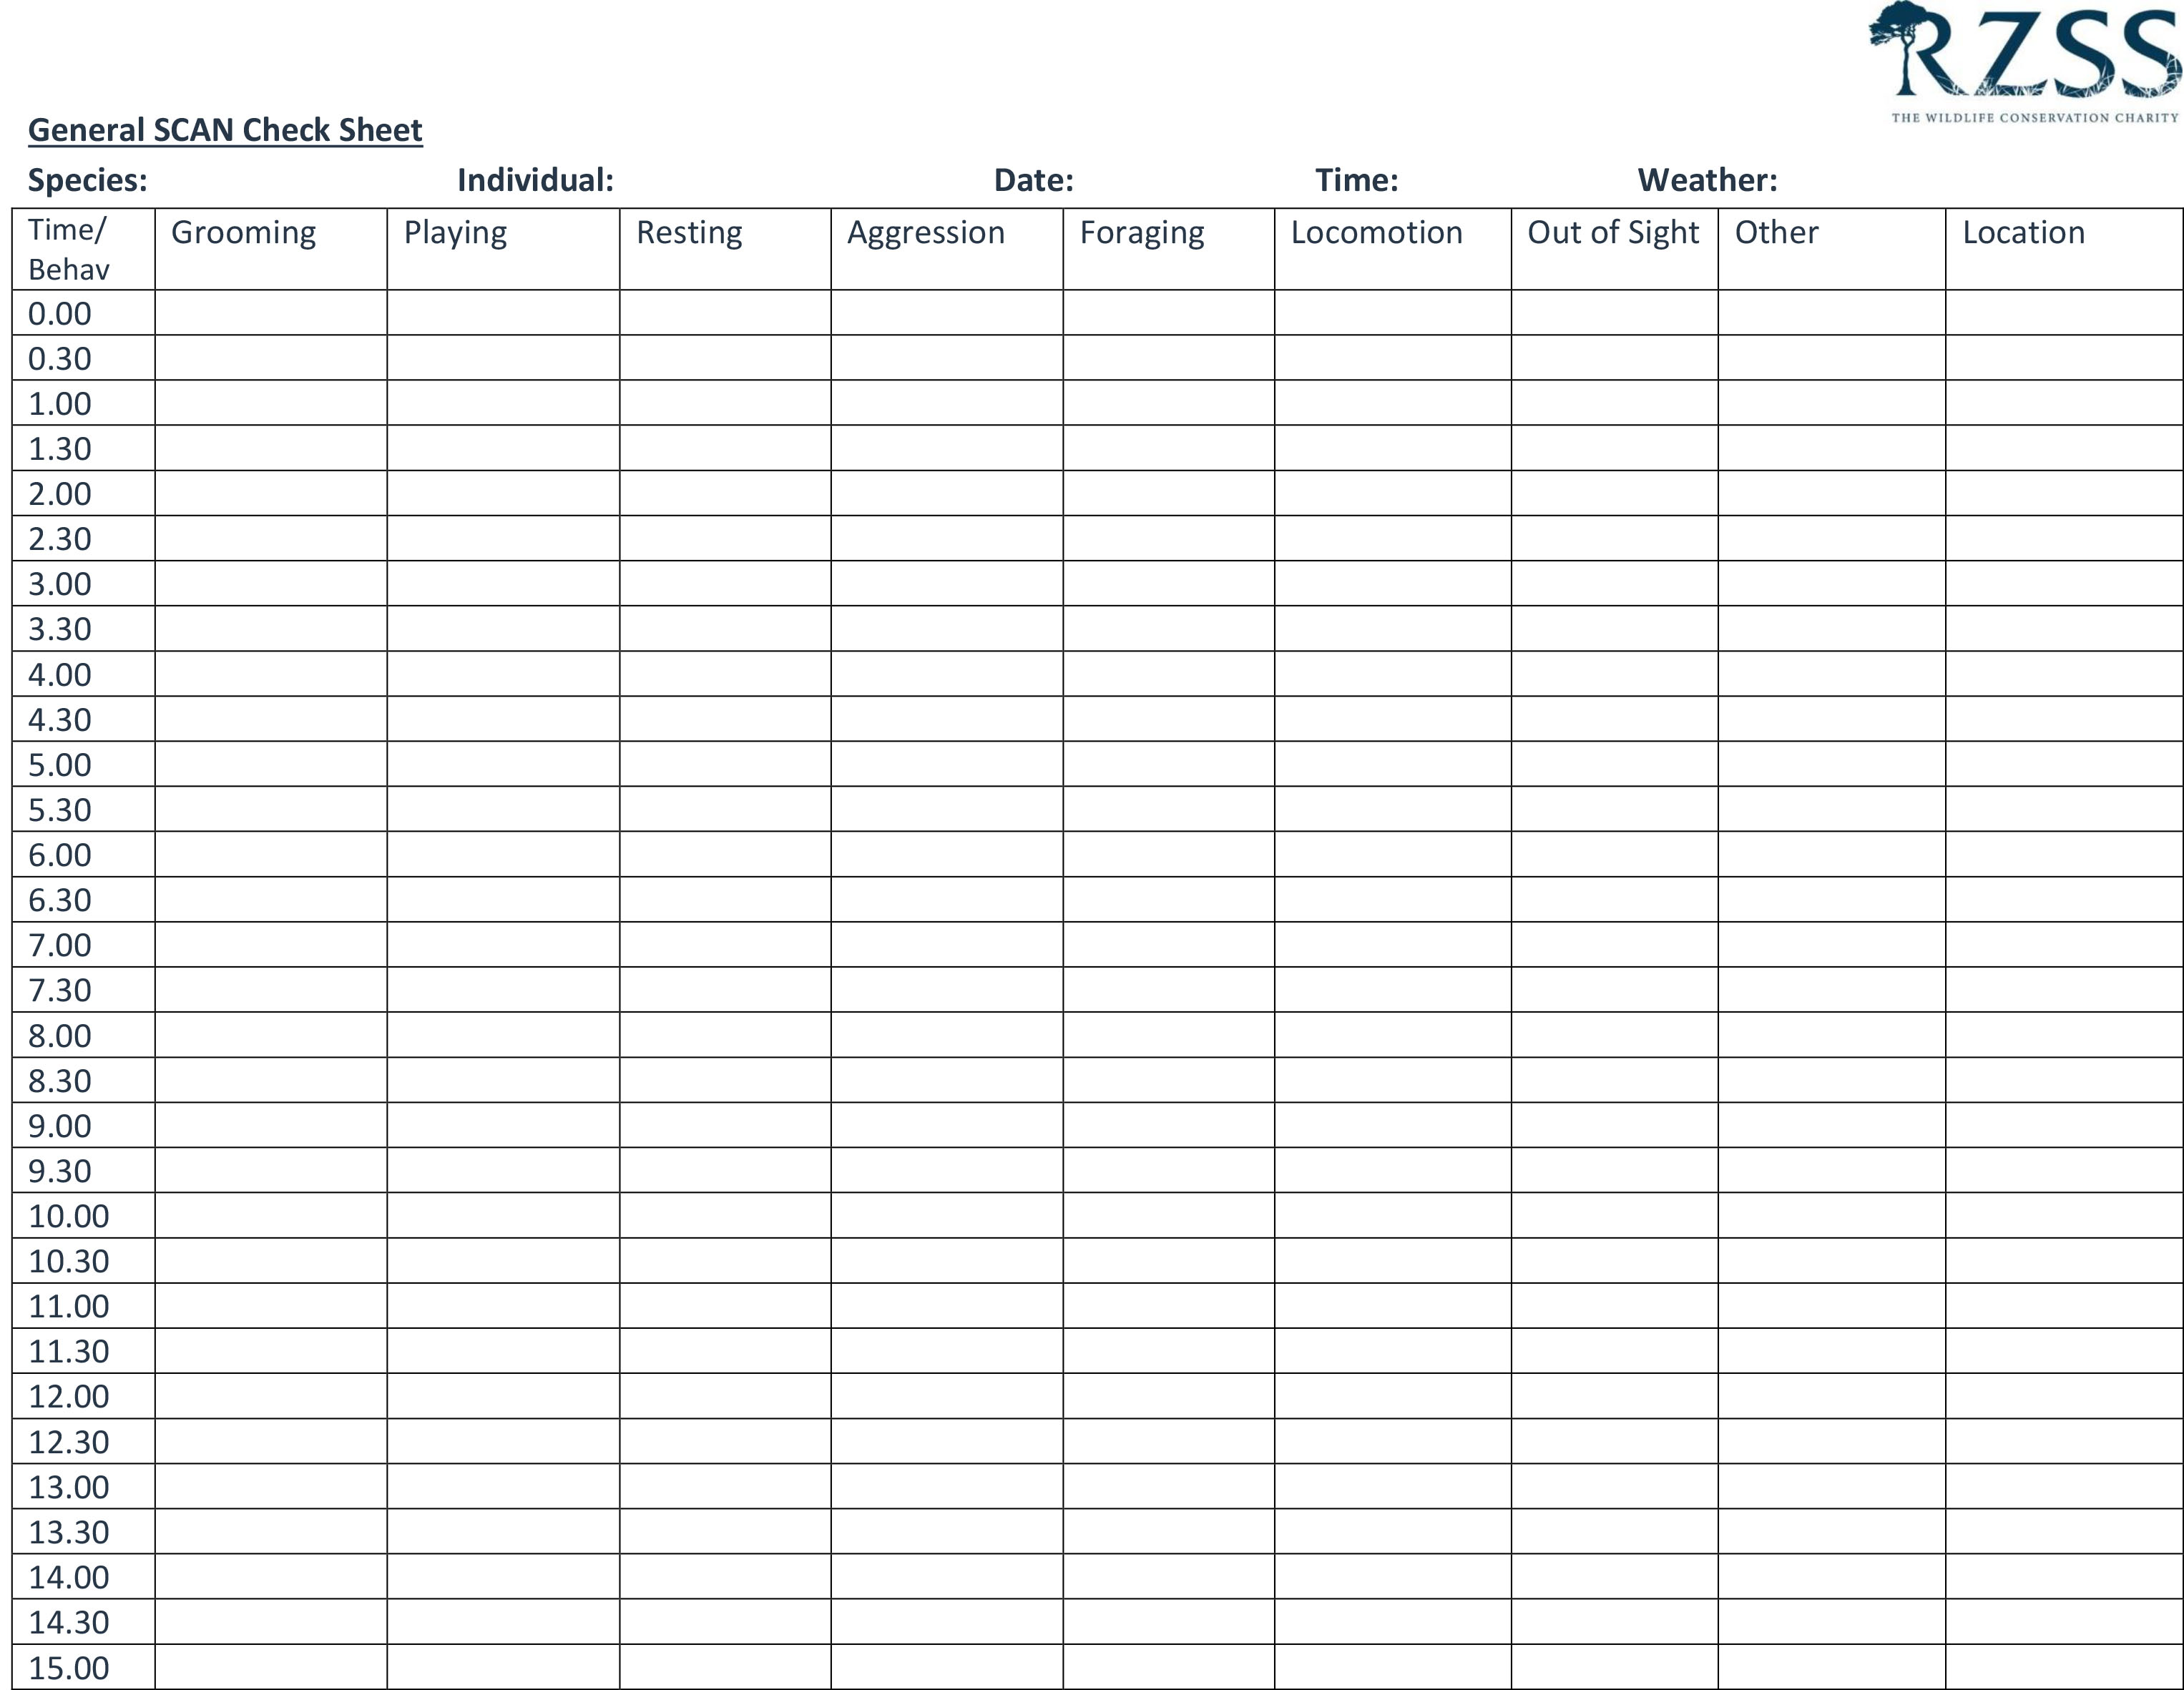
Below are two example datasheets. The first is for completing a focal sample. The second is for completing a scan sample. You can either use these or make your own. If making your own datasheet, you can change the name of the columns to match the behaviours within the ethogram unique to your study species!


How to Complete a Focal Sample
When completeing a focal sample, choose a single individual in your study species to observe. At the start of your observation, start your stopwatch, write in the time column "0 seconds" or "0s" for short and then tick the box that describes what the animal is doing. When the behaviour changes, write down the time in the time column and tick what the beavhiour changed to. Repeat this process every time the beaviour of the individual you are following changes, until the end of your observation (after, 5, 10 or 15 minutes - whatever you decide!)
How to Complete a Scan Sample
In contrast, a scan sample requires you to record the behaviour of all individuals that are visible, not just one. This can be better to get replication; the more we observe animals and the more individuals from a species our observations are taken from, the more our finding are likely to be a true reflection of the animals normal behaviour. But we cant record the exact time every single animal changes behaviour, so in scan sampling, every 30 seconds we record (from left to right) what every individual is doing on the 30 second mark. Often this involves tally marking in each column to show how many were playing, grooming, etc.. Then you wait, recording nothing, until 60 seconds and you repeat the scanning process. Carry this on until the full time of your observation is complete. (5, 10 or 15 minutes - whatever you decide!)
Why Does the Datasheet Suggest I Record the Weather?
When doing research, scientists often take note of the weather, time, date, etc. to record these uncontrolable factors. Sometimes researchers discover patterns based on these factors, as these 'variables' often effect the behavious observed. By taking this into account, researchers may channge the way they interpret the results.
Out of Sight, Other and Location?
Our example datasheets include these 3 additional columns. Unlike the rest, they do not refer directly to an ethogram definition of behaviour. However in behavioural research we must be prepared for the unexpected! Often an animal may go out of view of the webcam or else out of view of the public in the zoo. This can be frustrating for a researcher (particularly when doing a focal sample on the individual) but they must simply wait for the animal to return to view whilst recording them on the datasheet as 'out of sight'. Similar, if the animal does something unexpected (outwith the ethogram) this can be described in the other column. Finally, some studies require the researcher to record where in the enclosure the animal is (e.g. indoor or outdoor). For these studies, we have included a location column. Further additional columns may be added depending on the nature of the research taking place (e.g. number of visitors at the enclosure).